In-house product · Climate & environment data
Thai Sky Watch: weather, air and flood intelligence for Thailand
A bilingual weather, air and flood dashboard for all 77 Thai provinces, built on open data and local models
- Engagement
- Six phases, ongoing
- Team
- Product · Engineering · ML
- Services
- Product, Data engineering, Machine learning, Web app
- Year
- 2026
The brief
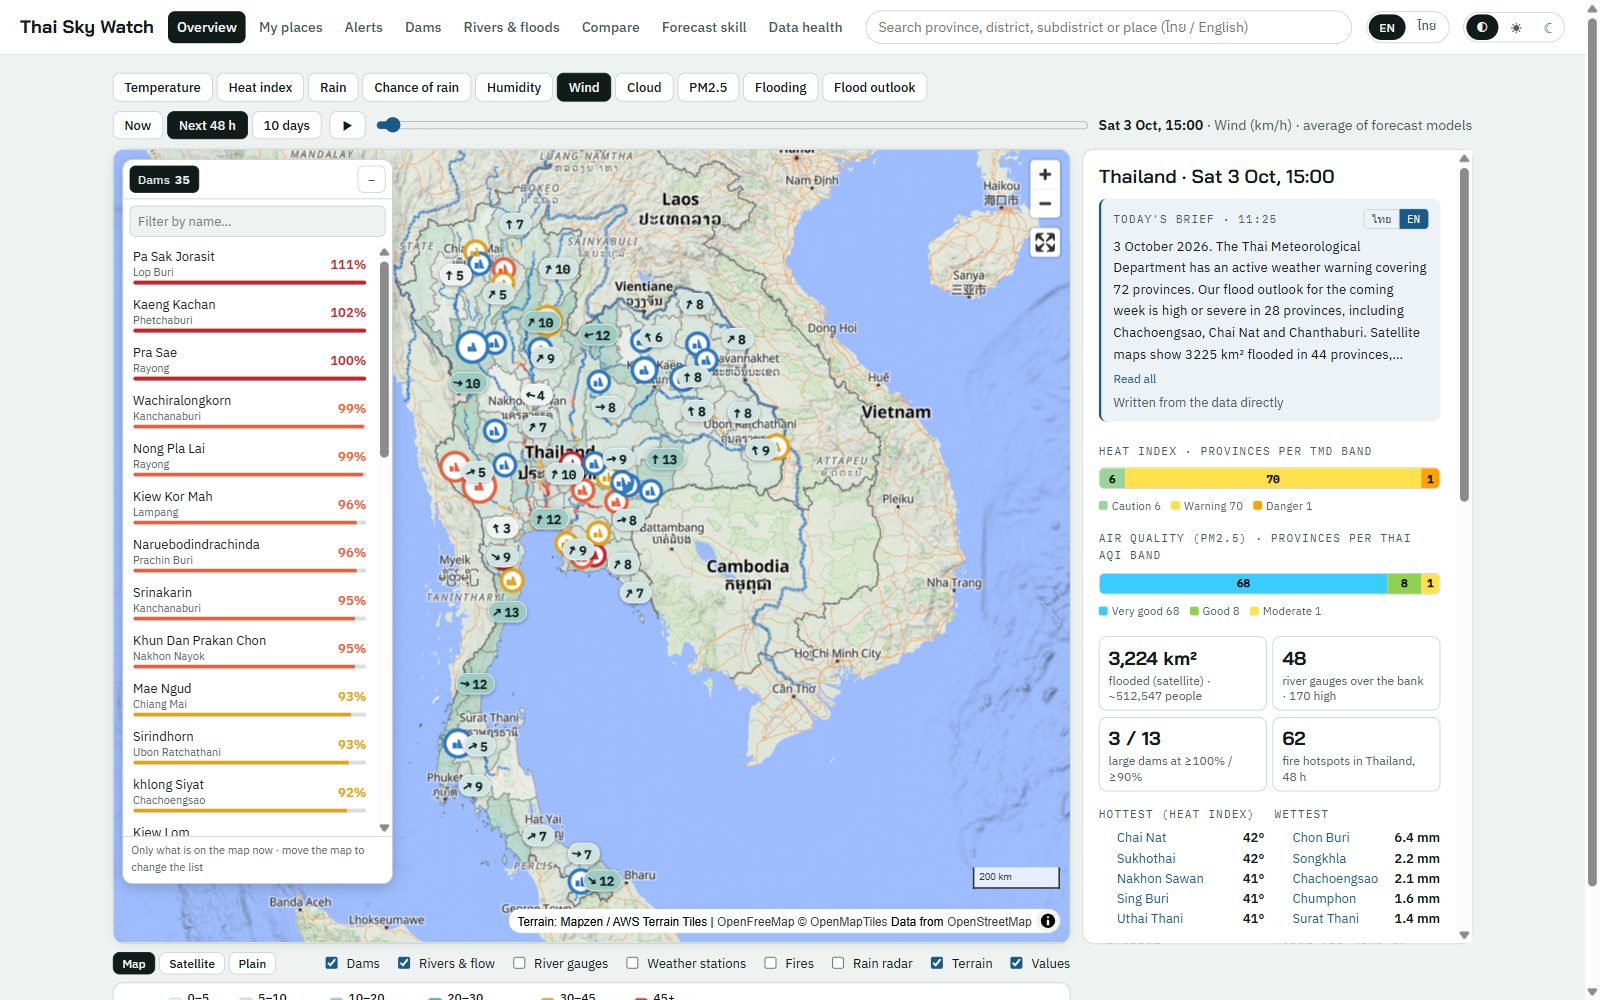
Thailand’s weather, air-quality and flood information is spread across many agencies, each with its own site, format and language. Thai Sky Watch is our own product: one dashboard that brings all of it together for every one of the 77 provinces, adds forecasts of its own, and explains the day in plain Thai and English. It started as a tool for a few people in Bangkok, and it grew into a full data platform.
What it does
- Overview map — the whole country coloured by temperature, heat index, rain, chance of rain, humidity, wind, cloud, PM2.5 or satellite-detected flooding, with a time slider across the next 48 hours or 10 days. Overlays for dams, rivers and flow, river gauges, weather stations, fire hotspots and live rain radar.
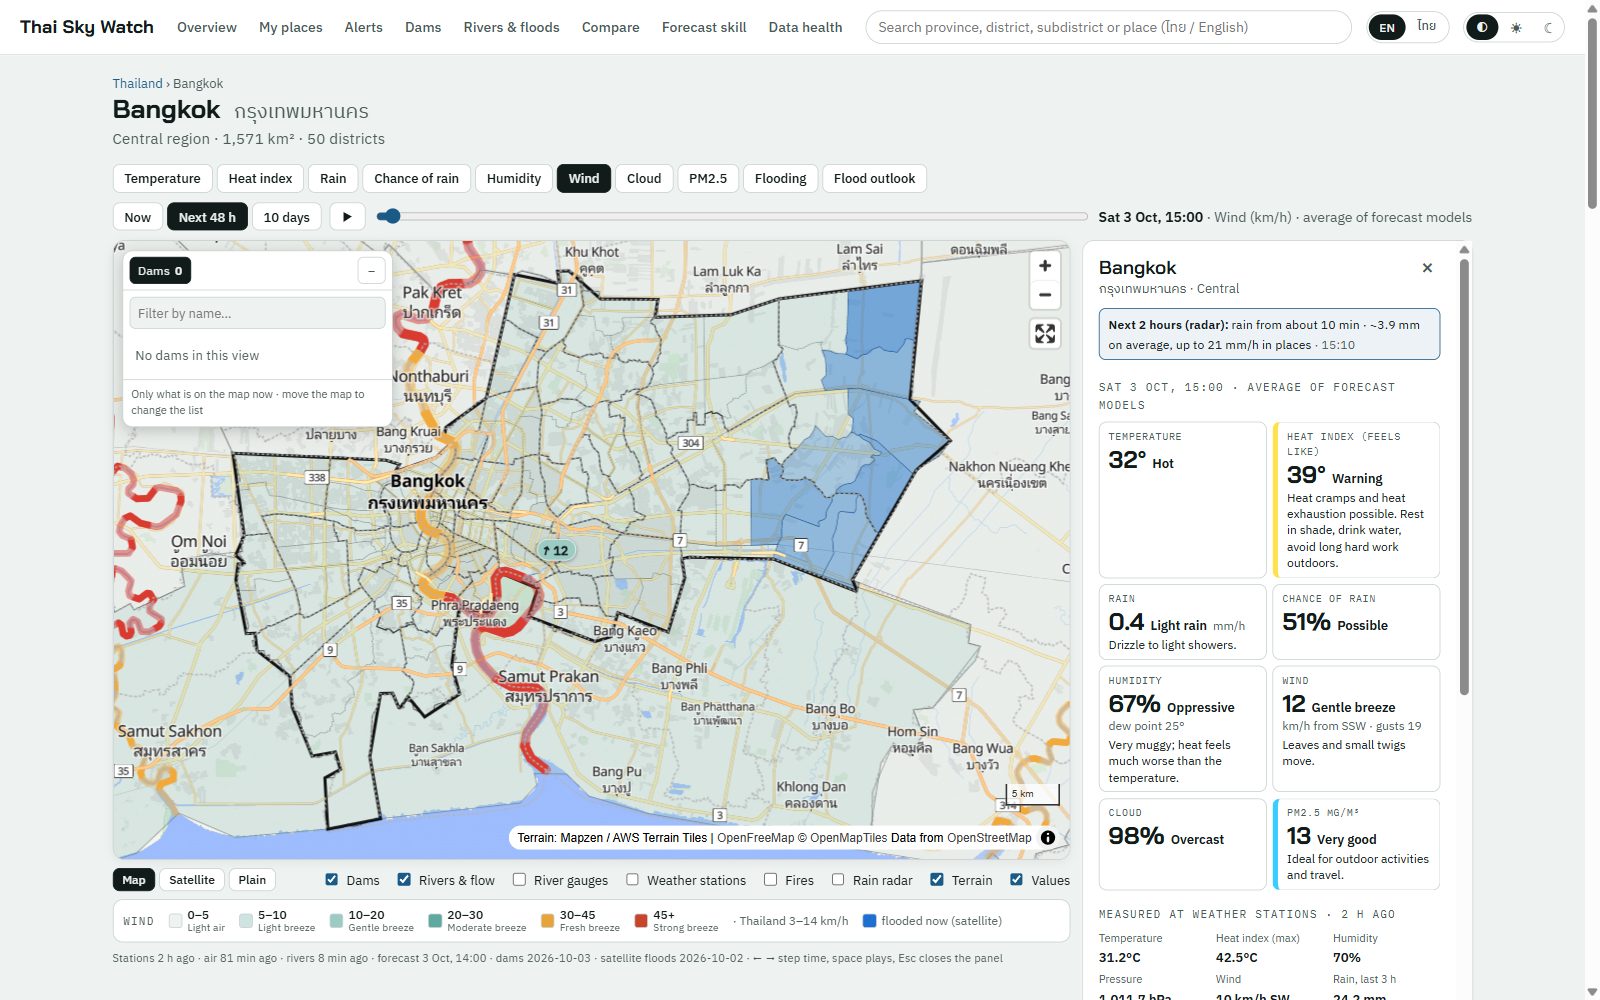
- Province, district and subdistrict pages — station readings now, a 10-day multi-model forecast, the next 48 hours by model, PM2.5 measured against a global air-quality model, river gauges with freeboard, nearby dams and currently flooded subdistricts.
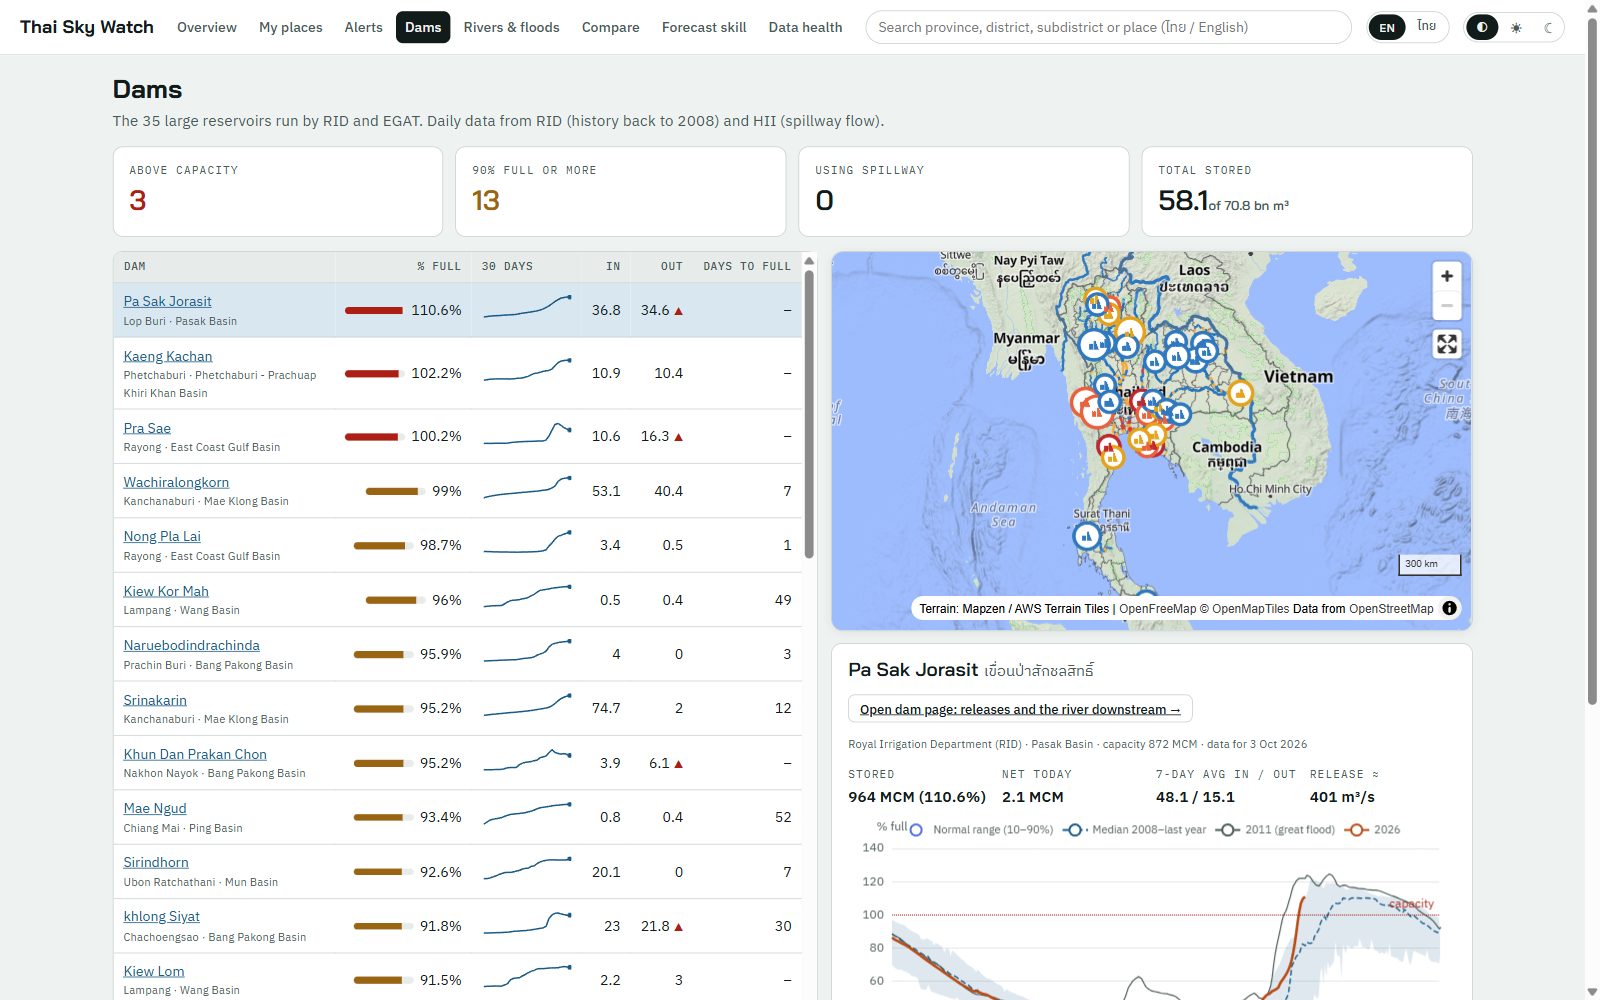
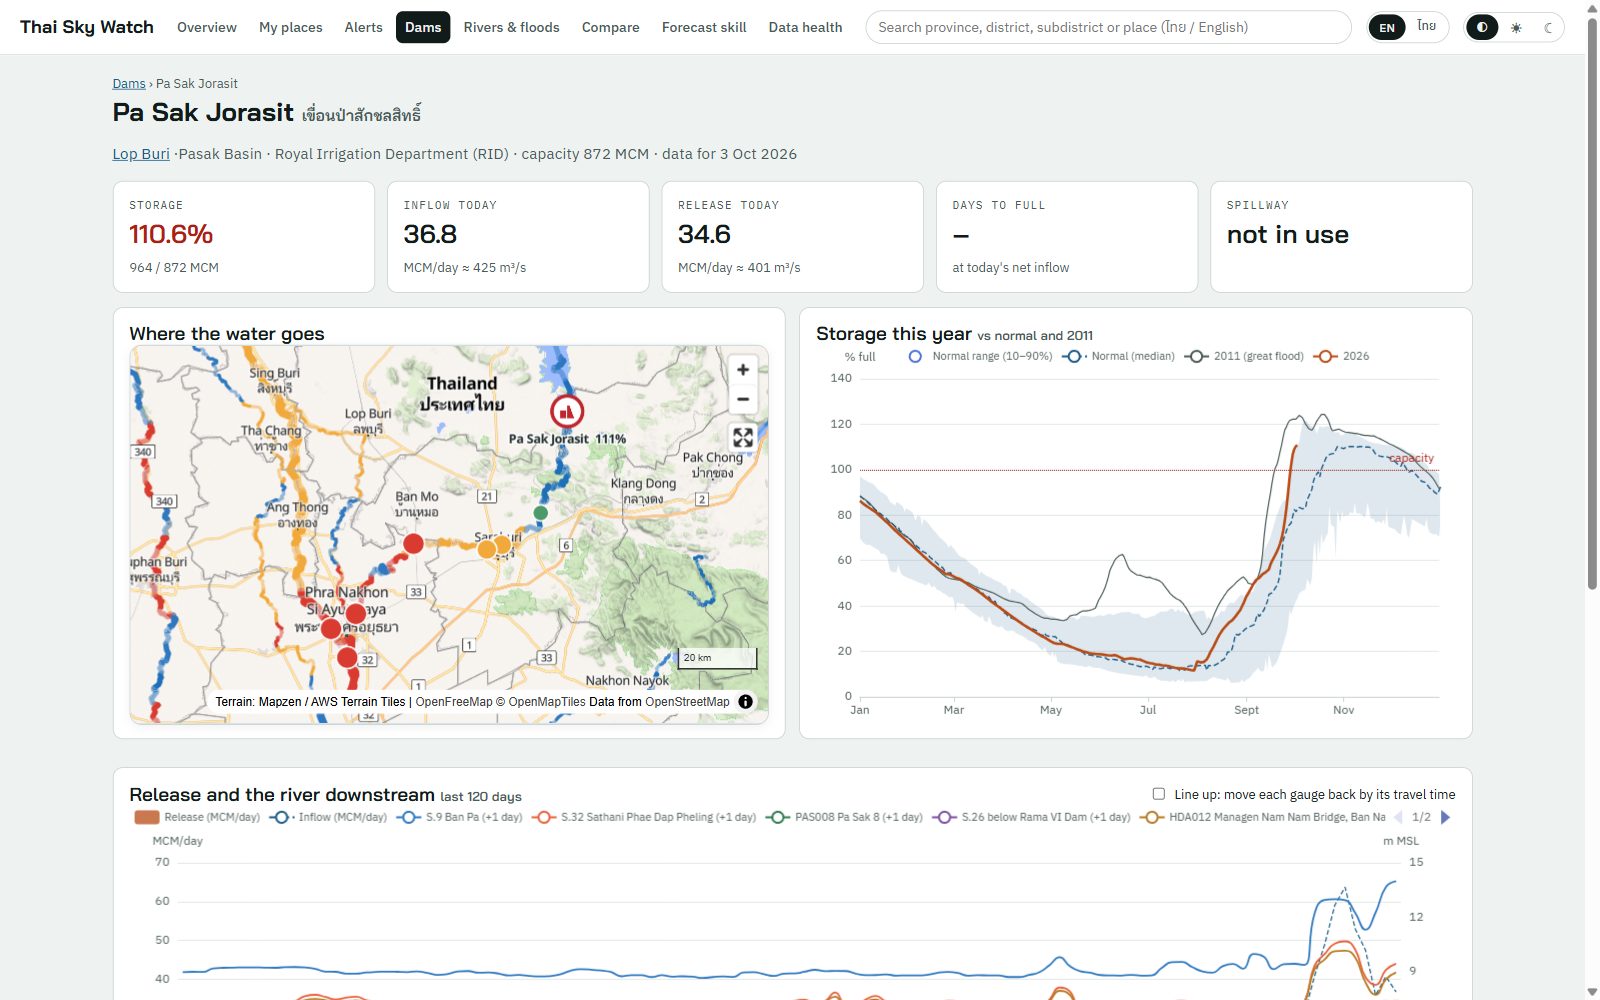
- Dams — all 35 large reservoirs: percentage full, 30-day trend, inflow and release, days to full, and for each dam a chart of this year against the long-run normal range and the 2011 great flood, plus the river gauges downstream of its release.
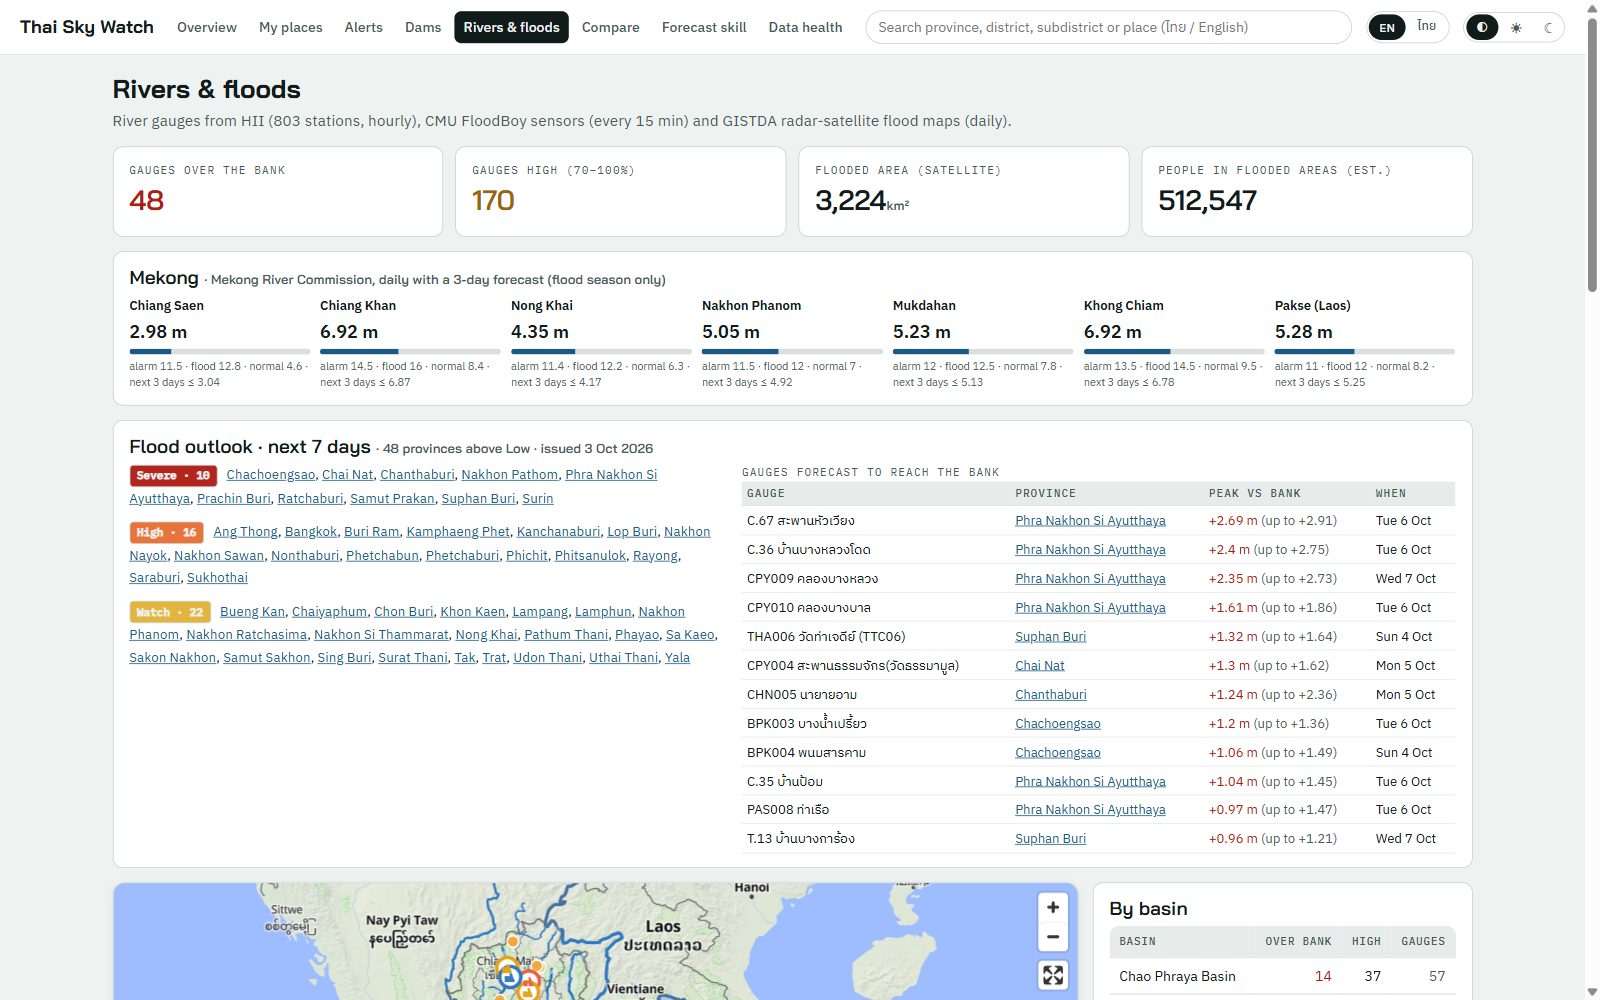
- Rivers & floods — more than 800 river gauges by basin and status, Mekong levels with a 3-day forecast, a 7-day flood outlook per province, and the gauges forecast to reach the bank, with dates.
- Alerts — checked every 30 minutes against stations, gauges, dams, satellite floods, hotspots and forecasts; each alert closes itself when the condition clears. Official weather warnings are matched to provinces.
- My places — save home, work or family places and see rain in the next two hours, heat, air, flood risk and nearby river levels for each.
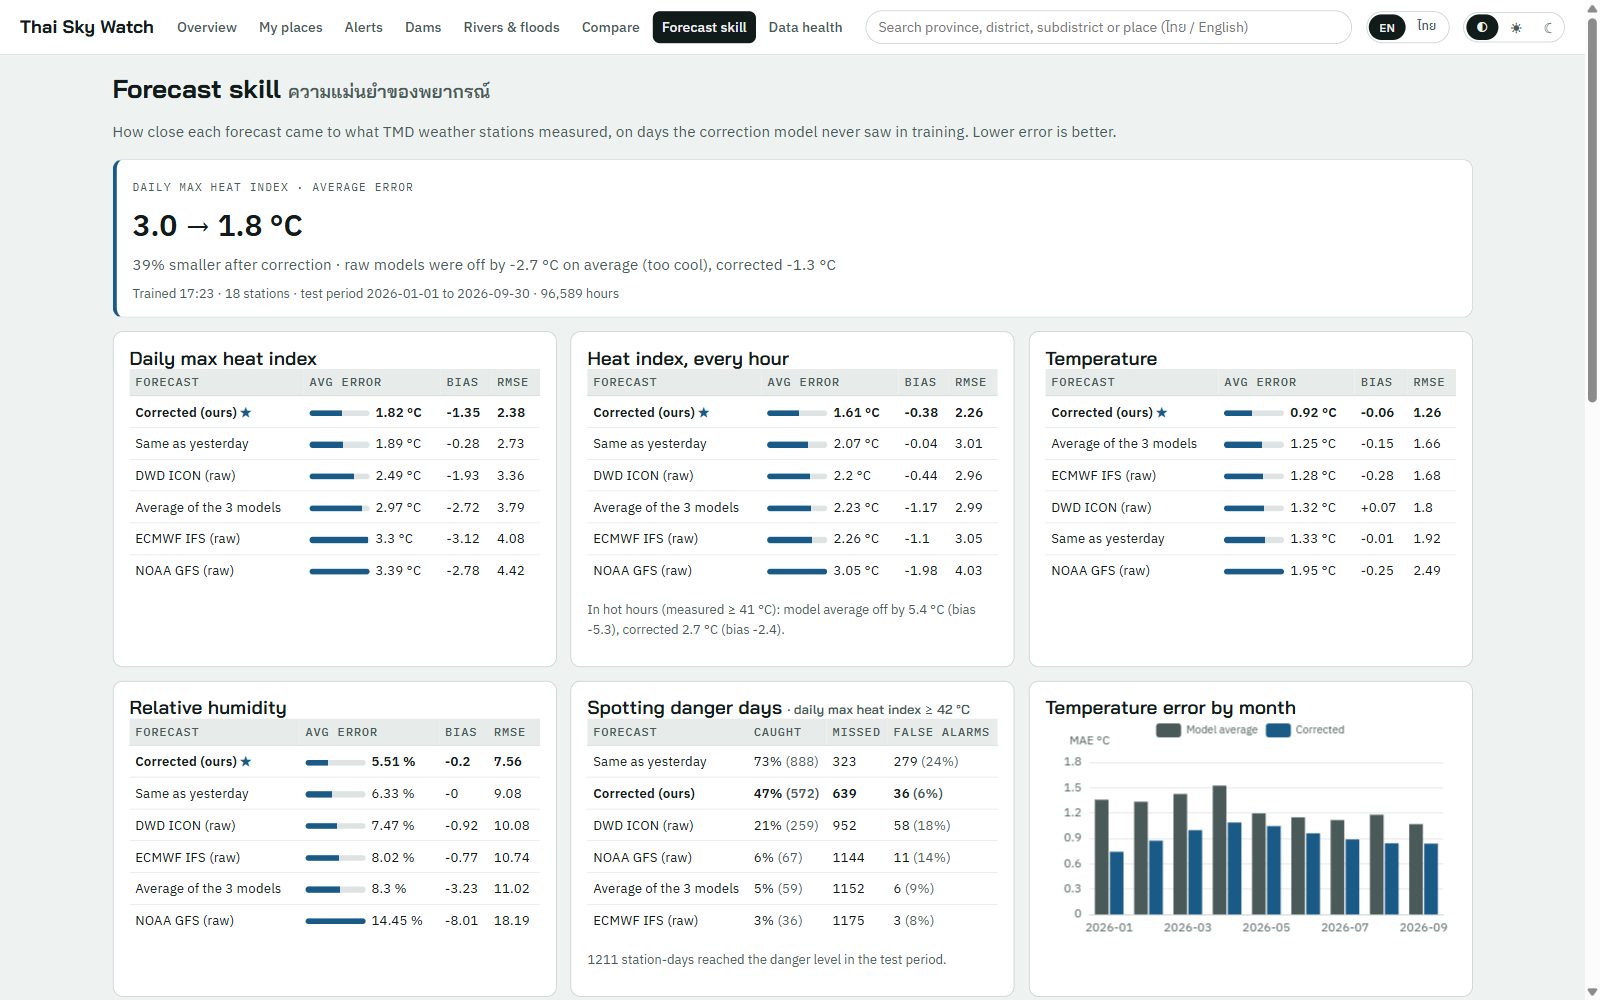
- Forecast skill — how every model scored against what the weather stations actually measured, always on dates the models never saw in training.
- Data health — every collector’s last success, last failure and data freshness, refreshed every minute.
Architecture
Four containers on Docker Compose, with one native service beside them:
- Database — TimescaleDB on PostgreSQL 17 with PostGIS. Fifty tables, eight of them time-series hypertables, holding observations, forecasts, river and dam records, satellite flood areas, alerts and model scores. Province, district and subdistrict boundaries are stored as geometry so every query can answer “which province is this station in?” in SQL. The database runs in Thai time.
- Worker — Python. A scheduler process runs about forty jobs: collectors for each feed, model training on Sundays, forecasts twice a day, a radar nowcast every ten minutes, the daily brief, alerts, and a nightly archive. Every job records its run in the database, which is what the Data health page reads. History loaders are resumable, so a multi-day backfill can be stopped and continued.
- API and dashboard — a FastAPI service with thirty endpoints and generated API docs. The same container serves the dashboard, built as a static SvelteKit site.
- Backup — a nightly compressed database dump, keeping the last fourteen.
- Language model — a Thai-tuned open model, 4B parameters, running locally beside the containers and reached from the worker over the Docker host bridge. No data leaves the system.
Data
Eleven collector modules bring in official Thai meteorological, hydrological and air-quality feeds, satellite flood and fire-hotspot products, four global weather models with their reanalysis and archived runs, and regional river forecasts. Each collector uses a polite HTTP client that respects rate limits and retries with backoff, and stores the raw payload before parsing it, so a parsing bug never loses data. Where a feed keeps only a few months of history, the system has been collecting since day one so its own archive outlives the source’s.
Models
Every forecast on the site is either a published model or one we trained, and the Forecast skill page says which did better.
- Heat correction — raw global models run too cool in Thailand. A LightGBM model trained on station history against archived model runs corrects the daily maximum heat index; on the skill page at the time of writing, average error fell from 3.0 °C to 1.8 °C on held-out days.
- Rain chance — the probability of at least 1, 10 or 35 mm at each station. The page is honest about it: the model beats climatology for the first two thresholds and shows no skill yet for heavy rain.
- River level forecast — one to seven days ahead at every gauge. Upstream gauges and dams are learned from the records rather than hand-drawn, and dams are only linked where they are hydrologically upstream. The forecast feeds a Low / Watch / High / Severe flood outlook per province, cross-checked against satellite floods, the Mekong and a global river model.
- PM2.5 forecast — one to three days at each station, blending LightGBM with a pretrained time-series model, with fire hotspots counted in rings out to 1,000 km.
- Radar nowcast — a two-hour extrapolation of the radar mosaic using optical flow, run every ten minutes, verified against what then fell, and shown as an animated map layer.
- Climate normals — reanalysis per province and day of year, so an alert can say “7 °C above normal for this date” rather than just “hot”.
The daily brief
Twice a day the worker writes a short brief in Thai and English. The language model is not allowed to make anything up: the facts are composed as sentences from the database first, and the model only rewords them. The output is rejected if it contains a number that was not in the input, drops a number or a place name, or mixes in the wrong script, and the plain sentences are published instead. A brief takes about thirteen seconds on CPU alone.
Interface
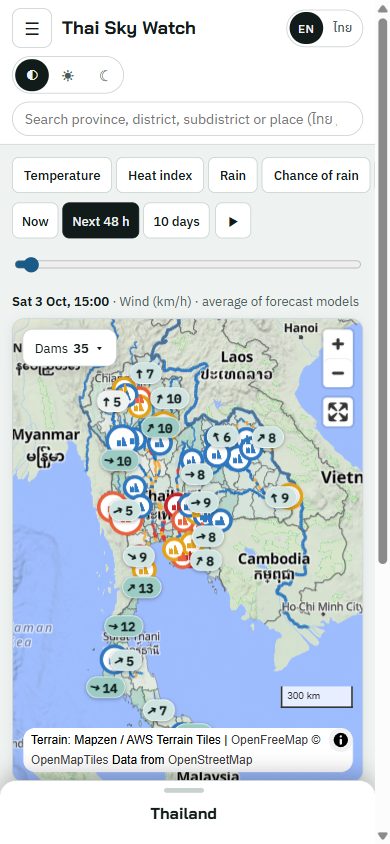
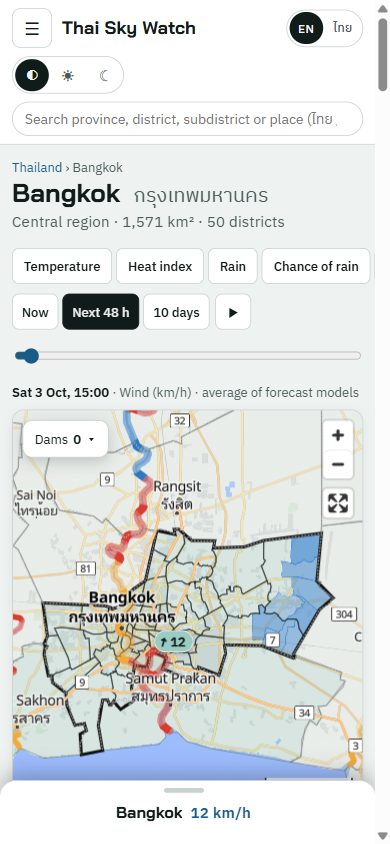
SvelteKit with Svelte 5, MapLibre GL for the maps and ECharts for every chart. The whole interface switches between Thai and English — labels, units, dates in the Buddhist year, and Thai names for provinces, dams and basins. Gauges and rivers that are published only in Thai get a romanised English name generated against the official gazetteer. Light, dark and auto themes. On a phone the map takes the screen and the panels become a bottom sheet.
Alerts and operations
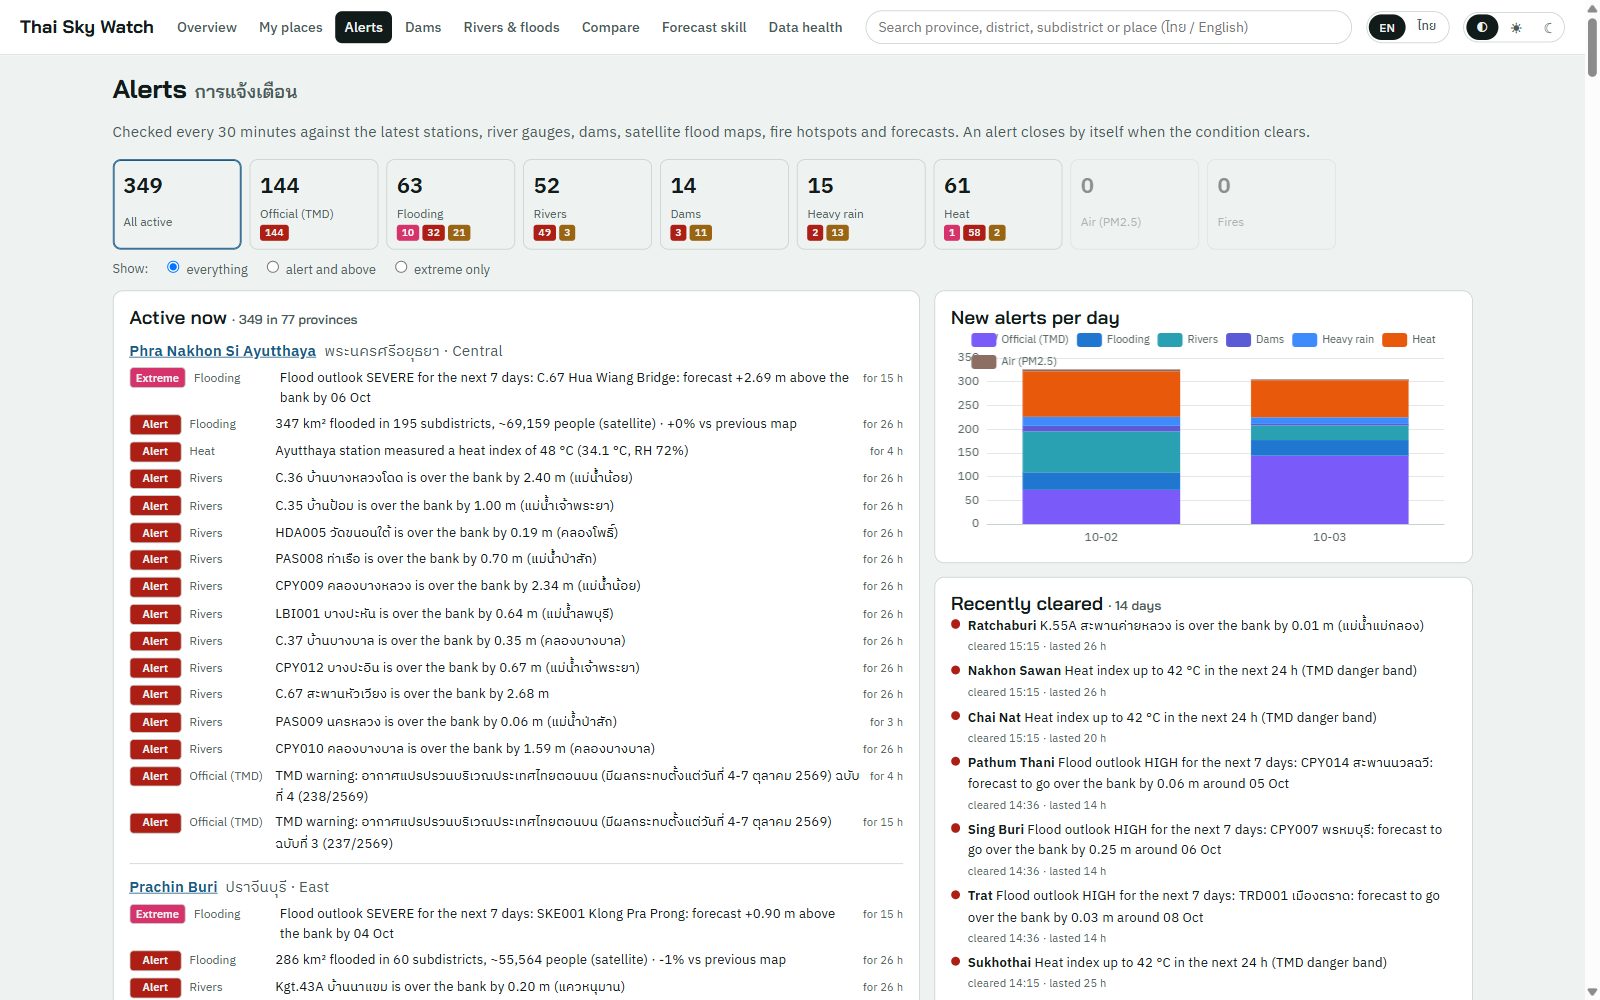
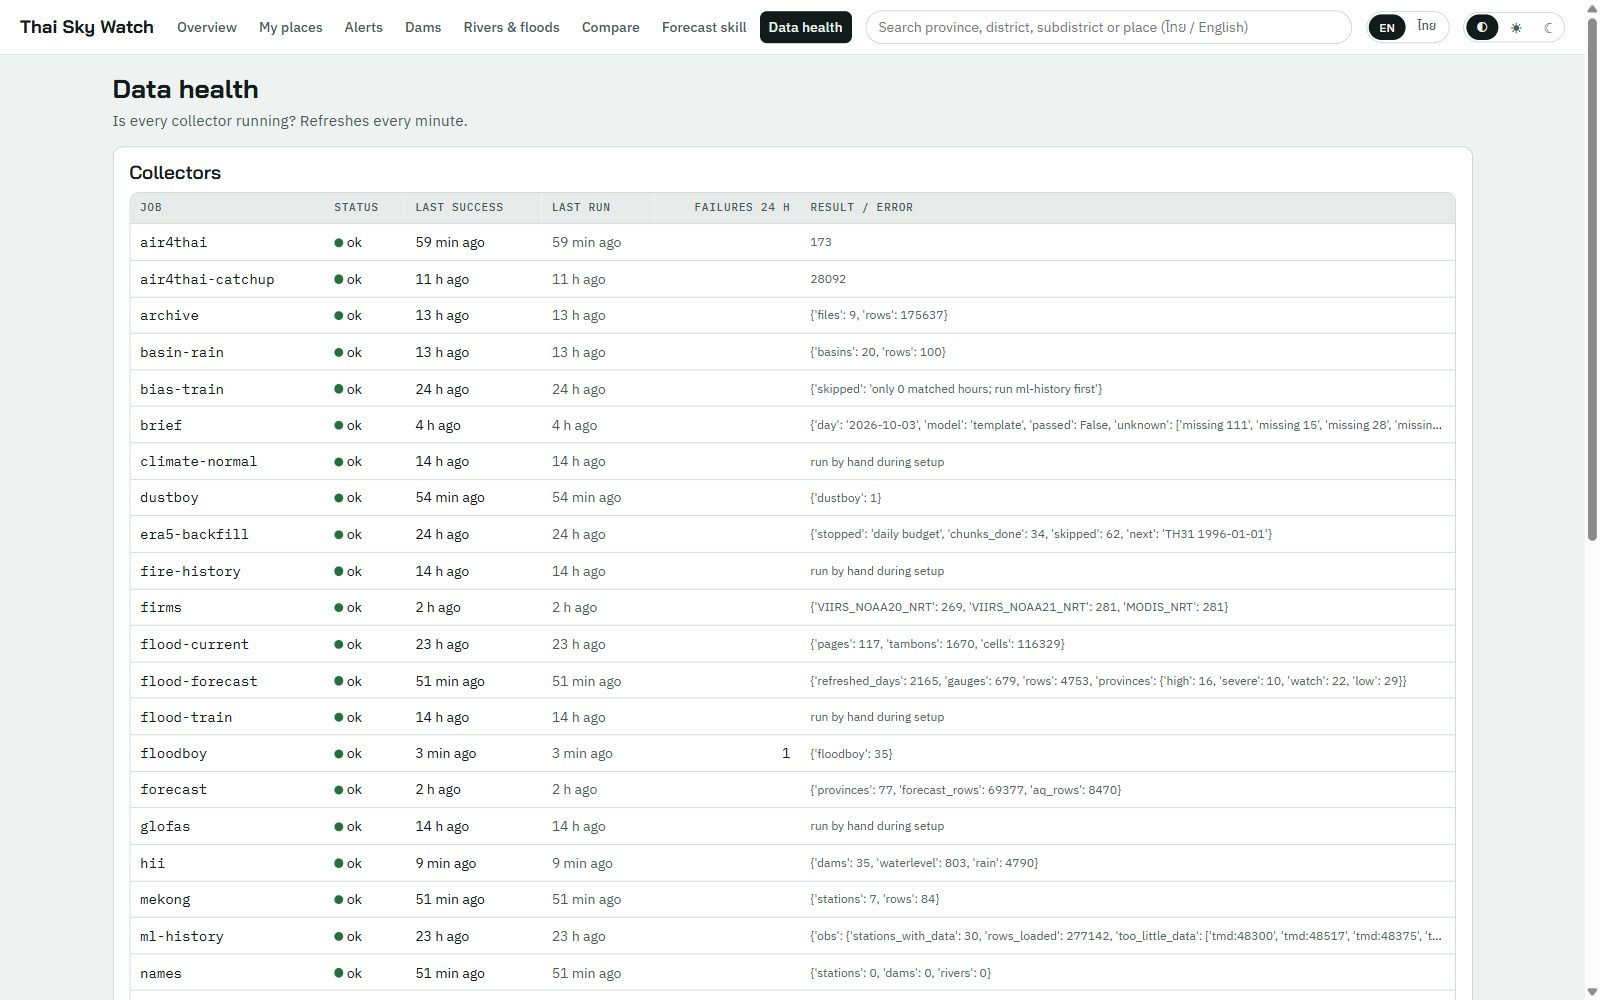
Alerts are rules, not a model: a gauge over its bank, a dam above capacity, a heat index in the danger band, a hotspot near a town, air in an unhealthy band. Each one records what triggered it and closes itself when the reading returns to normal, so the list is always current. Optional delivery to a messaging app for the ones that matter. The Data health page exists because a dashboard that quietly shows stale data is worse than one that shows nothing; every collector’s state is visible, down to the error text.
Status
Running daily since September 2026, through six build phases: schema and feeds, collectors and history, the dashboard, alerts and the brief, the forecast models, and the radar nowcast. Around 11,000 lines of Python, SQL and Svelte. The product is private. If you would like to see it, ask for a demo.
Contact
Tell us what you’re building.
Send a short brief. We read every message and reply within one business day.